Project Description: Please provide a description of the project.

 visualcomplexity.com | A visual exploration on mapping complex networks
Project Description: Please provide a description of the project.

 Information is Beautiful
we’re an independent collective making sense of the world with infographics & data-visualswe turn data, information and knowledge into interactive graphics, stories, live performances and books Stories about Arts & Culture Dataviz & Design Food & Drink Gender & Diversity Ideas & Perception Just For Fun Money & Economy Nature & Climate Science & Health Tech & Digital Beautiful News

 Data Visualization and Infographics Resources — Smashing Magazine
Data visualizations and infographics can make complex datasets easier to understand and comprehend. By creating a graphical represenatation of data and statistics, complicated concepts and information can make more sense in less time. Many visualizations focus on representing a specific set of data or statistical information. Others focus on less-concrete topics, providing a visual representation

 flare | visualization on the web
To begin making your own visualizations, download flare and work through the tutorial below. Need more help? Visit the help forum (you’ll need a SourceForge login to post). Flare is open-source software released under a BSD license, meaning it can be freely deployed and modified (and even sold for $$). Flare’s design was adapted from its predecessor prefuse, a visualization toolkit for Java. Appli

 Tripwire Magazine | Handpicked goodies for entrepreneurs, developers and web designers
The quality and availability of WordPress e-commerce themes makes WordPress a serious choice as an online shop platform. In fact, WordPress has moved rapidly from being mainly a blogging platform and is now one of the top CMS systems for traditional websites. Lately,... Welcome to our Website Awards for best free WordPress themes. We are hosting this award to showcase the best websites to visit wh
 Data Visualizations: 5 Beautiful Social Media Videos
1. SweetNTweet If all Twitter searches were this fun, I'd probably do little else than stare at them all day. This experimental Twitter search engine is made with Processing; it lets you choose keywords for a Twitter search, and results are displayed in the form of petals which turn into tweets when they reach the destination. I haven't been able to find the actual application, but you can see a d

 27 Visualizations and Infographics to Understand the Financial Crisis
27 Visualizations and Infographics to Understand the Financial Crisis I’ve said it before, and I’ll say it again. If there’s anything good that has come out of the financial crisis it’s the slew of high-quality graphics to help us understand what’s going on. Some visualizations attempt to explain it all while others focus on affected business. Others concentrate on how we, as citizens are affected

 pagetutor.com - pagetutor リソースおよび情報
This webpage was generated by the domain owner using Sedo Domain Parking. Disclaimer: Sedo maintains no relationship with third party advertisers. Reference to any specific service or trade mark is not controlled by Sedo nor does it constitute or imply its association, endorsement or recommendation.
 今流行のWebサービスを分類してみた - よっぱ主義。
[PR]上記の広告は3ヶ月以上新規記事投稿のないブログに表示されています。新しい記事を書く事で広告が消えます。 最近、しょっちゅうと言う位にTwitterやらはてなブックマークやらといった、いろいろなWebサービスを利用することが多くなってきました。そんな今流行のWebサービスを整理・分類してみました。 図 Social Media in Japan(ver 0.60) Social Media in Japan by H.Yoshikawa, Y.Yamaguchi, T.Nakamura is licensed under a Creative Commons 表示-非営利 2.1 日本 License. Based on a work at www.briansolis.com 旧画像はこちら ・ver0.4(2009/01/04) ・ver0.5(2009/01/05) (※図中の
 10 Useful Techniques To Improve Your User Interface Designs — Smashing Magazine
Web design consists, for the most part, of interface design. There are many techniques involved in crafting beautiful and functional interfaces. Here’s my collection of 10 that I think you’ll find useful in your work. They’re not related to any particular theme, but are rather a collection of techniques I use in my own projects. Without further ado, let’s get started. Web design consists, for the
 ネット文化圏の勢力図を作ってみた。 - ネットナナメ読み - 山田井ユウキ - builder by ZDNet Japan
※本記事は、11/29 13:18に最新の追記・修正が入っています。 builder読者の皆さん、こんにちは。 職場で隣のデスクの先輩に「僕は今年のクリスマスも一人寂しくTVを見ることになりそうです」と言ったら、「俺は一人でイルミネーションを見に行く」と呟かれてしまった山田井ユウキです。 この先輩には一生勝てないと思います。 そんなことはさておき。 今回もネット黎明期を支えた個人サイトについて更新しようかと思ったのですが、急きょ別の企画を思いついたのでそっちを書くことにしますね。 題して、 です。 「ネット文化圏」って何よ? という方のためにちょこっと説明すると、広大なネット世界には数多くの文化圏がそれこそ宇宙の星々のごとく点在しており、それぞれが独自のカルチャーやコミュニティを築いて発展しています。 たとえばmixiや2ch、ニコニコ動画など……。 そういった、ネットに大きな影響を与えて
 ページ内のユーザーの視線をシミュレートする -Feng-GUI - Feng Shui for Graphic User Interfaces
AI-Powered Neuromarketing Web, Ads, Video, Signage, Packaging AI-Powered Neuromarketing Instant feedback on visuals, at a fraction of the cost and time of traditional tools. Test websites, adverts, videos, print, shelf layout, signage and packaging design. Turn visual data into actionable insights. Stay ahead of the market by leveraging AI to boost productivity and reduce costs. complete feature l
リリース、障害情報などのサービスのお知らせ
最新の人気エントリーの配信
j次のブックマーク
k前のブックマーク
lあとで読む
eコメント一覧を開く
oページを開く


 https://www.toby-ng.com/new/the-world-of-100/
 Photo
Photo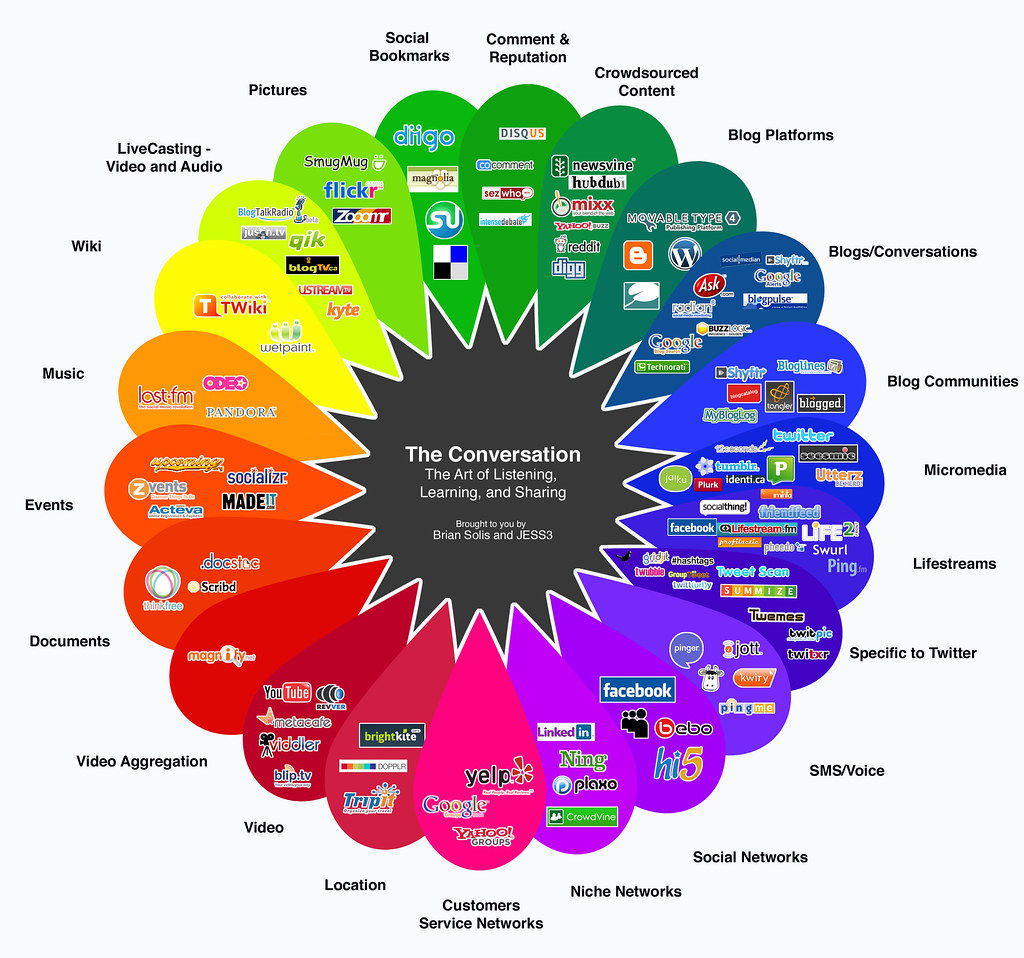 https://farm4.static.flickr.com/3009/2735401175_fcdcd0da03_b.jpg
 http://www.jackcheng.com/maxing-out-your-triangle